
Home Water Damage Statistics 2026
Key home water damage data findings:
- 1 out of every 60 insured homes (1.6%) in the U.S. files a water damage claim per year.
- Insurance companies pay an average of $13,954 per water-related property damage claim.
- As of 2022, water damage and freezing accounted for 27.6% of all home insurance claims.
- Flood damage is one of the most serious threats to U.S. homeowners in 2024. It can result in significant property damage, with properties requiring extensive repairs. This year alone, a total of $627 million has been paid by all U.S. states on flood damage claims.
- 98% of basements experience some level of water damage.
This article is for homeowners, renters, insurers, and anyone who might be concerned about the risks of water damage.
We have analyzed insurance data reports, Federal Emergency Management Agency (FEMA) data, and water damage restoration reports to provide insights on home water damage statistics and the impact of home water damage on homeowners.
Home Water Damage Statistics — National Overview
- From 2018 to 2022, the claims frequency for water damage was 1.61 claims per 100 house-years (a house-year is equivalent to one policy covering a house for 12 months). This means one out of every 60 insured homes files a water damage claim annually.
- Water damage and freezing are the second most common types of claim after wind and hail damage. In 2022, they accounted for 27.6% of all homeowners insurance claims.
- The average insurance payout for water damage and freezing claims between 2018 and 2022 was $13,954 per claim. This was calculated based on the accident year incurred losses and excludes loss adjustment expenses.
- Burst pipes, leaky faucets, malfunctioning water supply systems, and other plumbing failures are common causes of water damage. Flooding and snowmelt also cause significant water damage to homes.
- Based on a 2016 study, water damage claims occur most between January and February. This is probably because of cracked or burst pipes due to freezing.
In warmer climates like California, there are higher water damage incident reports because of aging homes and external pipe locations.
- About 14,000 people in the U.S. experience some form of home water damage daily.
Despite home water damage being a major problem for homeowners, many people underestimate its financial impact.
In a survey to find out how prepared homeowners are for water damage incidents, only 17% of homeowners said they are concerned about non-weather-related water damage.
Compared to 84% of homeowners who have smoke detectors, only 17% of homeowners said they have a water sensor in their homes.
| Frequency | About 1 in 60 insured homes (1.6% of homes) file a water damage claim annually |
| Percentage of Claims | Water damage and freezing account for about 27.6% of all home insurance claims |
| Average Payout | $13,954 per claim |
| Types of Damage Covered | Burst pipes, accidental leaks, house fires, roof leakage, heavy rain or hail, ice dams |
| General Impact | Flooding has impacted 99% of U.S. counties between 1996 and 2019; 98% of basements suffer water damage |
Percentage of Homeowners Insurance Losses Due to Water Damage and Freezing
In insurance, claims can be classified as losses for insurance companies. So the percentage of homeowners insurance losses, as used in the table below, represents the percentage of homeowners who filed a claim due to water damage and freezing issues.
That is, the number of water damage and freezing claims divided by the total number of claims made in the year.
For example, in 2010, water damage and freezing made up 21.1% of all homeowners insurance claims. This means water damage and freezing represented 21.1% of losses suffered by insurance companies on homeowners insurance claims.
Looking at the data from the Insurance Information Institute (III), we see that there was a significant rise in the percentage of homeowners insurance losses due to water damage and freezing from 2010 (21.1%) to 2015 (45.1%).
The percentage fell to 17.5% in 2012 but resumed its upward movement after that. 2015 experienced more events related to water damage and freezing than any other year in recent history.
But after it peaked in 2015, the percentage of homeowners insurance claims due to water damage and freezing showed fluctuations.
It dropped to 29.5% in 2016, and then decreased significantly to 19.5% in 2017. From here, it has generally increased, with a drop to 19.6% in 2020.
After that, it increased to 23.4% in 2021 and 27.6% in 2022. In 2022, the increase in water damage incidents is in part attributed to Hurricane Ian’s impact, particularly in Florida.
The general overview is that while the percentage of losses due to home water damage incidents has varied significantly over the years, it’s still a major concern for property owners and insurers alike.
Estimated Total Losses Due to Water Damage and Freezing (2010-2022)
| Year | Percentage of Homeowners Insurance Losses Due to Water Damage & Freezing (Estimated) |
| 2010 | 21.1% |
| 2011 | 22% |
| 2012 | 17.5% |
| 2013 | 26.4% |
| 2014 | 33.7% |
| 2015 | 45.1% |
| 2016 | 29.5% |
| 2017 | 19.5% |
| 2018 | 23.8% |
| 2019 | 29.4% |
| 2020 | 19.6% |
| 2021 | 23.4% |
| 2022 | 27.6% |
The Cost of Water Damage Repair Per State

While we don’t have specific home water damage statistics by state, we can provide some insights on the cost of water damage repair for each state.
Repair costs will take into account the price of labor, repair difficulty, and the weather, among other factors. The average repair costs for water damage vary by state. This is understandable because some states generally cost more to live in than others.
Given that specific figures are unavailable as repair costs aren’t set in stone, we can only approximate from one state to another. For example,
- California: $10,000 – $30,000
High living costs and frequent natural disasters are reasons for high repair costs. - New York: $8,000 – $25,000
New York’s high costs are driven by urban density and high property values. - Florida: $7,000 – $20,000
Hurricanes and tropical storms have increased the demand for repair services in Florida. - Texas: $6,000 – $18,000
The state’s diverse climate and frequent coastal flooding cause costs to vary widely. - Hawaii: $12,000 – $35,000
Shipping and labor costs are higher because it is a remote location. - Wyoming: $3,000 – $8,000
Due to its low population and low living costs, water damage repair services are more affordable. - North Dakota: $3,500 – $9,000
Like Wyoming, low population density brings competitive pricing. - South Dakota: $3,200 – $8,500
Rural areas have lower repair costs because of their lower population.
For different states, water damage repair costs vary greatly. Regions like Wyoming charge only about $3,000, while in more expensive states like Hawaii, repair costs can go as high as $35,000.
Generally, the cost range homeowners should expect is between $4,500 and $20,000, depending on the location as well as the factors that caused the damage.
With the average insurance payout at about $13,954, homeowners with insurance should have enough to cover water damage repair costs.
Estimated Cost Ranges for Water Damage Repair by State
| State | Estimated Cost Range | Attributes/Explanations |
| Alabama | $4,000 – $10,000 | Moderate, depends on urban vs rural areas |
| Alaska | $7,000 – $18,000 | High, remote location and shipping costs |
| Arizona | $4,500 – $12,000 | Moderate, varies by region |
| Arkansas | $3,500 – $9,000 | Lower, predominantly rural |
| California | $10,000 – $30,000 | High, urban density and high living costs |
| Colorado | $5,000 – $14,000 | Moderate to high, urban areas more expensive |
| Connecticut | $7,000 – $20,000 | High, high living costs |
| Delaware | $5,000 – $12,000 | Moderate, smaller state with variable costs |
| Florida | $7,000 – $20,000 | High, frequent storms |
| Georgia | $5,000 – $13,000 | Moderate, urban areas more expensive |
| Hawaii | $12,000 – $35,000 | Very high, remote location |
| Idaho | $3,500 – $9,500 | Low to moderate, rural areas cheaper |
| Illinois | $5,500 – $15,000 | Moderate to high, urban density |
| Indiana | $4,500 – $12,000 | Moderate, varies by location |
| Iowa | $3,500 – $9,500 | Lower, predominantly rural |
| Kansas | $3,500 – $9,000 | Lower, rural areas dominate |
| Kentucky | $4,500 – $11,500 | Moderate, mix of urban and rural |
| Louisiana | $7,000 – $18,000 | High, frequent storms |
| Maine | $3,500 – $8,500 | Lower, rural areas |
| Maryland | $6,000 – $17,000 | High, urban areas like Baltimore |
| Massachusetts | $7,000 – $20,000 | High, high living costs |
| Michigan | $4,500 – $12,500 | Moderate, varies by urban vs rural |
| Minnesota | $5,000 – $13,000 | Moderate, mix of urban and rural |
| Mississippi | $3,500 – $8,500 | Lower, rural areas dominate |
| Missouri | $4,500 – $11,500 | Moderate, urban areas more expensive |
| Montana | $3,000 – $7,500 | Lower, less demand |
| Nebraska | $3,500 – $8,500 | Lower, predominantly rural |
| Nevada | $5,000 – $13,000 | Moderate, urban areas like Las Vegas |
| New Hampshire | $4,500 – $12,000 | Moderate, mix of urban and rural |
| New Jersey | $7,000 – $20,000 | High, urban density and living costs |
| New Mexico | $4,500 – $11,000 | Moderate, rural areas cheaper |
| New York | $8,000 – $25,000 | Very high, especially in NYC |
| North Carolina | $5,000 – $13,000 | Moderate, varies by location |
| North Dakota | $3,500 – $9,000 | Lower, less demand |
| Ohio | $4,500 – $12,000 | Moderate, mix of urban and rural |
| Oklahoma | $3,500 – $8,500 | Lower, predominantly rural |
| Oregon | $5,000 – $13,000 | Moderate, urban areas more expensive |
| Pennsylvania | $5,000 – $13,000 | Moderate, mix of urban and rural |
| Rhode Island | $6,500 – $18,000 | High, high living costs |
| South Carolina | $5,000 – $13,000 | Moderate, varies by location |
| South Dakota | $3,200 – $8,500 | Lower, less demand |
| Tennessee | $5,000 – $13,000 | Moderate, urban areas more expensive |
| Texas | $6,000 – $18,000 | High, varies widely |
| Utah | $4,500 – $12,500 | Moderate, urban areas more expensive |
| Vermont | $3,500 – $8,500 | Lower, rural areas |
| Virginia | $5,000 – $13,500 | Moderate, varies by location |
| Washington | $6,500 – $18,000 | High, urban areas like Seattle |
| West Virginia | $3,500 – $8,500 | Lower, rural areas dominate |
| Wisconsin | $4,500 – $12,000 | Moderate, mix of urban and rural |
| Wyoming | $3,000 – $8,000 | Lower, less demand |
Factors Influencing Repair Costs
1. Extent of Damage
Minor leaks may only need corrective measures, while severe flooding may damage several rooms and parts of the building, which cost more to repair.
Hardwood floors can cost between $7 and $25 per square foot to replace, while carpet replacement costs between $2 and $8 per square foot.
2. Materials Used
The type of material used also determines the cost of repairs, as different materials have varying tolerances to water contact.
Vinyl plank flooring, for example, is more waterproof than carpets. Carpets, when exposed to moisture, can quickly absorb water.
If this is not addressed quickly, it may lead to mold growth. Treated timber is also a better option for woodwork, as untreated or improperly sealed timber is vulnerable to rot from prolonged water contact.
3. Labor Costs
The level of labor costs directly depends on the complexity of the job, as well as the market cost of labor in the region.
Depending on the complexity of the damage and the volume of work done, labor prices can range from $70 to $200 per hour and influence the cost of repairs.
Breakdown of Costs for Each Class of Water Damage
There are different classes of water damage based on the source and the severity of it. These directly affect the overall cost of repairs.
Class 1: Minimal Damage
The damage in this class is minimal and affects a very small area. It usually involves materials that are not very absorbent, like concrete or tile. The repair costs for Class 1 damage generally are low, between $150 and $500 on average.
Class 2: Significant Damage
Class 2 damage affects an entire room. It usually involves the replacement of carpets and sections of drywall that have absorbed moisture.
Class 2 damage repairs cost between $550 and $1,000, depending on the type of materials to be used and the severity of the damage.
Class 3: Extensive Damage
Here, the walls, ceilings, and floors become completely soaked in water. This can generally happen either through a very substantial leak or some flooding.
The repair cost for this damage could range from $1,100 to $3,200 because it would require heavier cleanup and more extensive repairs than any other class of water damage.
Class 4: Severe Damage
Class 4 damage is the most severe. Specialized drying techniques would be employed here because of the presence of moisture in materials that would be hard to dry, such as hardwood or plaster.
It is the most expensive repair and often exceeds $20,000. The complexity and cost of repairs often become the reason for selling a house with water damage to companies that buy houses.
The cost breakdown associated with each water damage class clearly indicates the need for urgency and prompt assessment in cases of home water damage.
Water that lingers indoors sinks deeper and deeper into the house and makes the damage more expensive to repair. This further complicates selling a damaged house, should the owner decide to sell their home as is instead of repairing it.
By area of the home, basement and plumbing damage are the most costly repairs, while bathroom fixtures and floors offer the lowest cost burden for homeowners.
Classes of Water Damage and Estimated Costs
| Class of Water Damage | Description | Average Cost Range |
| Class 1 | Minimal damage, small area affected, limited moisture absorption | $150 – $500 |
| Class 2 | Significant damage, entire room affected, walls up to 12 inches from the floor | $550 – $1,000 |
| Class 3 | Extensive damage, multiple rooms affected, including ceilings, walls, subflooring, and insulation | $1,100 – $3,200 |
| Class 4 | Severe damage, long-standing water, structural materials affected (e.g., stone, brick, hardwood) | $20,000 – $100,000 |
Average Repair Costs by Area of the Home
| Area Affected | Average Repair Cost Range |
| Bathroom Fixtures | $150 – $350 |
| Floors | $200 – $500 |
| Drywall | $300 – $800 |
| Ceiling | $350 – $1,250 |
| Roof | $400 – $1,700 |
| Basement | $500 – $80,000 |
| Plumbing | $1,000 – $4,000 |
Top 4 Causes of Water Damage
By understanding the leading risk factors for water damage, you can take precautionary steps to increase readiness and lower the chances of incidents occurring.
#1 Burst Pipes
The most common cause of water damage incidents in homes is burst pipes. Freezing temperatures and old plumbing systems are common causes of it.
Home water damage due to burst pipes can cost upwards of $5,000 to repair due to the volume of water released into the home.
#2 Appliance Malfunctions
Washing machines, dishwashers, and water heaters that malfunction tend to lead to heavy water damage whenever leaks occur.
#3 Roof Leaks
Roof leaks are another common cause of water damage, mostly due to a few missing shingles, poor installation, or just the age of the shingles. The leaks cause interior damage when they go unnoticed for long periods.
#4 Natural Disasters
Natural disasters like floods, hurricanes, or heavy rainfall are major causes of water damage in many parts of the country.
Flooding, droughts, tropical cyclones, heat waves, and severe storms account for 80-90% of all property damage throughout the United States arising from natural disasters.
Floods aren’t typically covered by regular homeowners insurance policies, and selling a house in a flood zone poses certain difficulties for homeowners.
Basement Water Damage
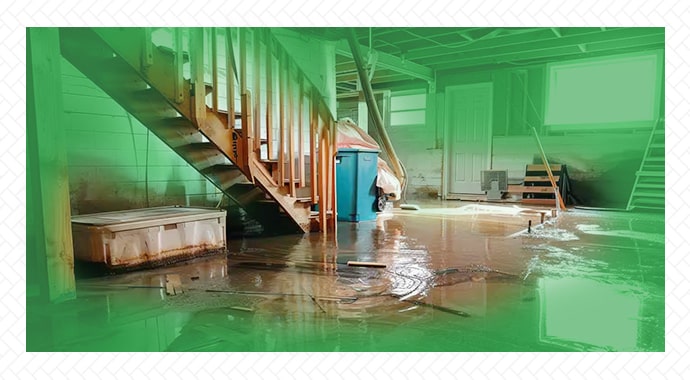
Basements are generally very prone to water damage. Basement water damage statistics show that in the U.S. alone, as many as 98% of all basements will undergo some level of water damage.
3 Most Common Causes of Basement Water Damage
1. Foundation Cracks
Cracks in foundation walls and floors are one of the main causes of basement water damage. They offer a channel for water to travel from outside the wall to the basement. Foundation cracks can occur due to soil movement, temperature changes, or bad construction practices.
2. Poor Drainage
Clogged drains in the surroundings of a home will cause additional water accumulation in basements. If the gutters have become clogged, the downspouts are not clear, and the rainwater does not drain away from the foundation, the basement of the house will be negatively affected.
3. Sump Pump Failure
Sump pumps are the most appropriate devices for maintaining basement dryness, particularly in areas that are prone to flooding.
In the unfortunate event of a failure of a sump pump or if its maintenance were to be handled inefficiently, that is enough to cause flooding in a house during times of heavy rainfall or snowmelt.
Flood Damage
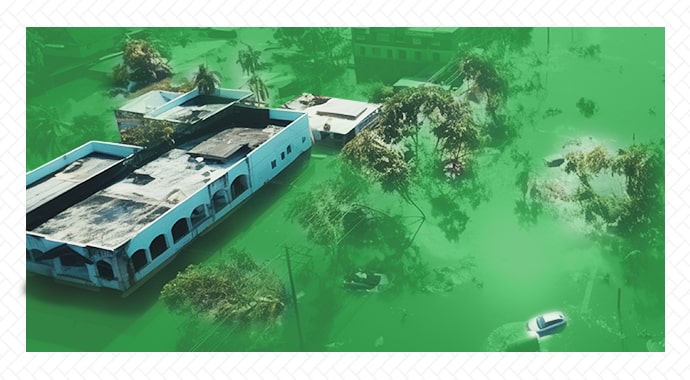
Floods pose the most serious threat to U.S. homeowners, causing significant damage and costly property repairs.
Damages caused by flooding vary from state to state as clearly indicated by flood damage statistics from the National Flood Insurance Program (NFIP).
Here are some specific flood water damage insurance claim statistics from the latest NFIP “Financial Losses by State” report:
- Flood damage claims totaling more than $627 million have been paid in 2024 by all the states in the U.S.
- Florida has paid total claims of more than $169 million over the year, with the largest number of flood damage claims across the nation at nearly 46,815 cases.
- Louisiana, with its constant heavy floods, has accumulated about $34 million in claims for flood damage.
- Guam and Montana are the only states that have reported no flood damage claims.
This data highlights the overwhelming impact of flood damage in different parts of the country. It shows the need for every homeowner to understand their flood exposure risk.
General homeowners insurance policies usually do not provide for flood damage costs, so a separate flood insurance policy must be obtained from the NFIP or private insurers.
Insurance Claims Paid for Flood Damages by State
| State | Number of Records |
Total Payments ($) |
| ALABAMA | 73 | 1,691,950 |
| ALASKA | 45 | 2,363,070 |
| ARIZONA | 14 | 58,048.4 |
| ARKANSAS | 81 | 3,598,450 |
| CALIFORNIA | 578 | 30,242,500 |
| COLORADO | 19 | 40,264.1 |
| CONNECTICUT | 274 | 4,424,770 |
| DELAWARE | 34 | 454,959 |
| DISTRICT OF COLUMBIA | 7 | 3224.41 |
| FLORIDA | 46,815 | 169,279,000 |
| GEORGIA | 955 | 9,768,250 |
| GUAM | 1 | 0 |
| HAWAII | 95 | 3,454,210 |
| IDAHO | 5 | 4,958.4 |
| ILLINOIS | 199 | 3,017,800 |
| INDIANA | 39 | 664,259 |
| IOWA | 251 | 13,004,800 |
| KANSAS | 36 | 1,020,350 |
| KENTUCKY | 43 | 900,830 |
| LOUISIANA | 2,627 | 34,554,200 |
| MAINE | 910 | 34,229700 |
| MARYLAND | 428 | 8,133,220 |
| MASSACHUSETTS | 388 | 8,900,540 |
| MICHIGAN | 98 | 466,191 |
| MINNESOTA | 136 | 4,414,110 |
| MISSISSIPPI | 96 | 1,690,360 |
| MISSOURI | 138 | 2,307,400 |
| MONTANA | 3 | 0 |
| NEBRASKA | 69 | 1,542,580 |
| NEVADA | 7 | 62,951.6 |
| NEW HAMPSHIRE | 314 | 11,205,900 |
| NEW JERSEY | 1,421 | 23,294,500 |
| NEW MEXICO | 13 | 173,398 |
| NEW YORK | 1,667 | 34,777,800 |
| NORTH CAROLINA | 1,018 | 18,155,900 |
| NORTH DAKOTA | 35 | 479,578 |
| OHIO | 116 | 1,742,170 |
| OKLAHOMA | 74 | 2,435,570 |
| OREGON | 43 | 567,573 |
| PENNSYLVANIA | 346 | 5,355,490 |
| PUERTO RICO | 285 | 1,034,730 |
| RHODE ISLAND | 152 | 2,768,570 |
| SOUTH CAROLINA | 567 | 9,558,670 |
| SOUTH DAKOTA | 38 | 542,734 |
| TENNESSEE | 113 | 2,297,240 |
| TEXAS | 2,486 | 43,596,400 |
| UTAH | 12 | 92,442.7 |
| VERMONT | 122 | 1,771,750 |
| VIRGINIA | 336 | 5,442,270 |
| VIRGIN ISLANDS | 33 | 472,447 |
| WASHINGTON | 124 | 2,652,770 |
| WEST VIRGINIA | 28 | 475,338 |
| WISCONSIN | 162 | 2,659,740 |
| WYOMING | 4 | 16,593.5 |
Key Takeaways and Actionable Steps

Home water damage is still one of the biggest concerns for Americans in 2024. About 1.6% of insured homes file water damage claims every year, and there are about 14,000 water damage incidents per day.
On average, such claims amount to about $13,954 each for property insurance companies, signifying the huge financial implications. This article has given you insights into residential water damage statistics in the U.S.
To reduce such risks as a homeowner, you need to keep performing routine plumbing checks and appliance maintenance, fix any leakages that are noticed as soon as possible, and work out a full backup plan with enough insurance, particularly in high-flood-risk areas.
Sources:
- iii.org/fact-statistic/facts-statistics-homeowners-and-renters-insurance
- krapflegal.com/recources/water-damage/water-damage-statistics-key-insights-and-trends-for-homeowners/
- cprrestoration.com/the-cost-of-water-damage-in-each-state/
- forbes.com/home-improvement/home/water-damage-restoration-cost/
- nfipservices.floodsmart.gov/sites/default/files/nfip_financial-losses-by-state_20240930.xlsx
